
Introduction
Today’s blog is all about Hooke’s law, and this week, I spent some time completing an experiment to look at the relationship in more detail. The experiment involved choosing three materials, one of which had passed its elastic limit, varying the load on each, and recording the change in the material’s length. In this blog, I will be analysing the results and reporting my finds.
What is Hooke’s law?
First of all, we should probably define what Hooke’s law is. The law states that when you apply a load to an elastic material, the change in the material’s length will be directly proportional to the weight of the load[2]. The word elastic is essential and, in this context, means that the material will return to its original shape once you remove the load. As we will see later, when a material is no longer elastic (unable to revert to its original shape), Hooke’s law no longer holds.
Hooke’s law can also be represented mathematically as the equation:
f = -kx [3]
Where F is the force applied, x is the change in the materials length(deformation), and K is the spring constant, which depends on the material and its dimensions. And in case you were wondering, the negative sign is used to show that the force and the deformation act in opposite directions.
Raw data
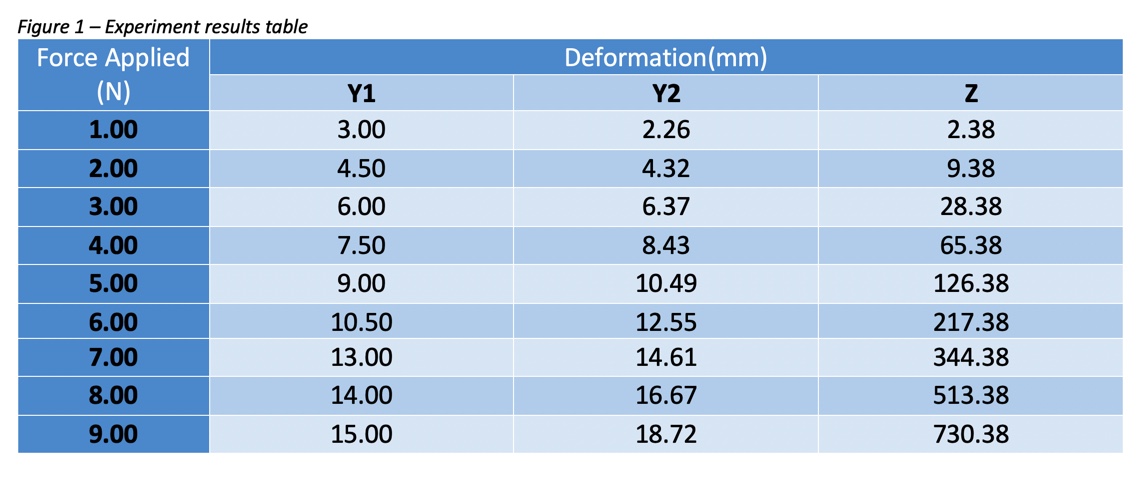
Figure 1 above is the results table that I obtained from the experiment. The labels Y1, Y2, and Z refer to the three different materials used. The load on each material was varied and the deformation was recorded.
Processed data
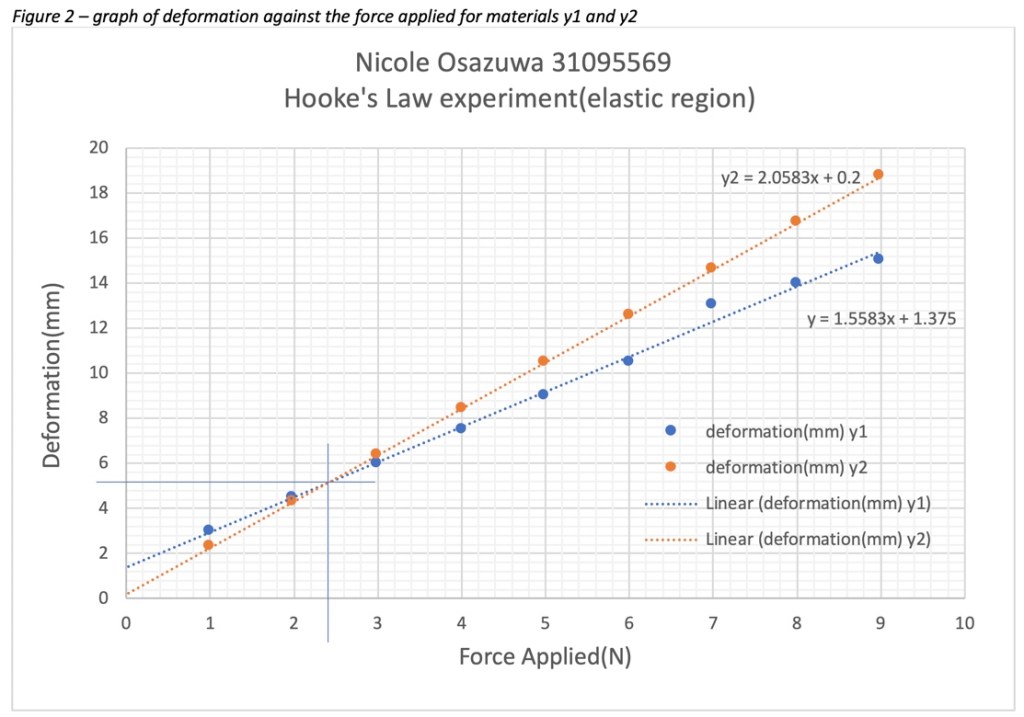
Figure 1 shown above displays the deformation against load for the materials y1 and y2. Just by looking at the graph, we can make some comparisons between the two materials, the first of which can be seen by comparing the gradients of the two trendlines. As mentioned earlier, we can represent Hooke’s law with the equation F = -Kx. This means that the spring constant (K) is equal to the inverse gradient of the trendline for each material. As material y1 has a gradient of 1.5583 therefore, its spring constant is 1/1.5583 or 0.64 N/mm whereas material y2 has a spring constant of 1/2.0583 or 0.46 N/mm if you don’t like fractions. The steeper gradient of y2 and, therefore, lower spring constant means that this material must be more elastic than the material y1 as it requires less force to get the same deformation.
The second thing that we should talk about is the accuracy of my results. Quantitates which are said to be directly proportional should in theory be represented graphically by a straight line that goes through the origin[4] and, as you can see from the graph this is not quite the case. I would say that the graph of y2 exhibits a tolerable amount of error as it is only 0.2 away from intersecting the origin whilst the graph of y1 is 1.375 away. This is likely to mean that there was some systematic error [5]. This could have been caused by a piece of equipment not being calibrated for the entirety of the data collection for the material y1.
However, this error has had an interesting effect on the graph. As the trendline of y1 misses the origin by quite a large margin, there is a point shown where the trendlines intercept each other which is not theoretically possible. This point is marked by the intercepting blue lines. So according to the graph, to get a deformation of around 5mm both materials need the force applied to be around 2.4N. This can be checked using simultaneous equations which I will demonstrate below.
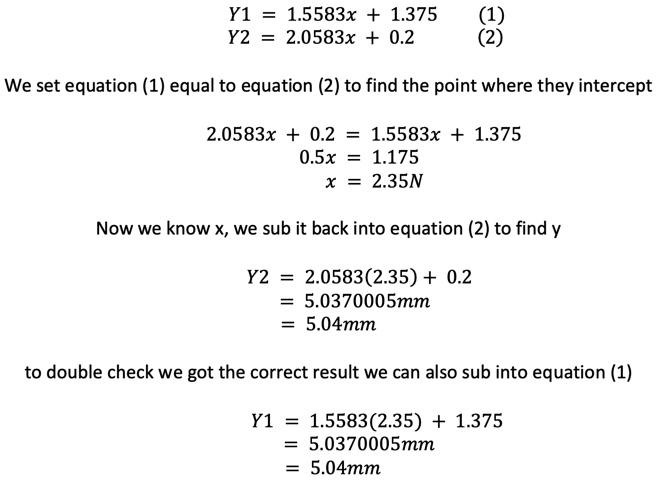
This shows us that according to my results both materials need a force applied of 2.35N to get a deformation of 5.04mm.
What happens beyond a material’s elastic limit?
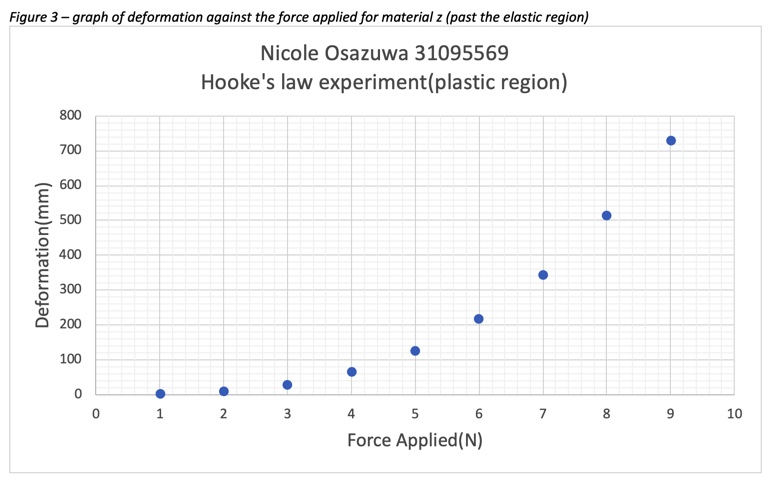
Figure three above displays the deformation against the force applied for material z and it is easy to see that the material has passed its elastic limit. The non-linear shape of the graph shows that Hooke’s law no longer applies for this material. The graph is actually much closer to being exponential.
Thank you for reading and I hope you enjoyed learning a bit about Hooke’s law today.
References
[1]Hooke’s law. (2012). [image] Available at: https://www.flickr.com/photos/strangefrontier/7490086192/in/photolist-cpSDF7-9CENv-9GBkE3-uYTPbF-NrSnav-YgF53Y-YgF46s-ZiAjEm-A5DE4e-N2gLyG-avS1su-zq8rf1-pWfRhB-2aY2MBx-NC1vpp-21CUGhv-21xYTmS-29rY6Sm-2cc2E1F-29s1c5m-79skDp-DmU92j-2bfwuM5-pqSNwM-pvur7s-WZVMQw-Ygy556-X89zKw-YoYx1F-s8cXCc-XayoWM-X8ntvw-YbzGEe-zMjMmk-NgWkoX-212YRM7-pw5Moq-79skBv-5kcViP-7kCMPk-LGbAbB-LG8QYQ-21mMz9y-5Bxxjm-XEBbo7-f4Bd4H-MtvgXU-5VX5xH-eJeyRp-zf65UM [Accessed 14 Nov. 2019].
[2] The Editors of Encyclopaedia Britannica (2017). Hooke’s law | Description & Equation. [online] Encyclopedia Britannica. Available at: https://www.britannica.com/science/Hookes-law [Accessed 11 Nov. 2019].
[3] Holzner, S. (n.d.). How to Calculate a Spring Constant Using Hooke’s Law – dummies. [online] dummies. Available at: https://www.dummies.com/education/science/physics/how-to-calculate-a-spring-constant-using-hookes-law/ [Accessed 11 Nov. 2019].
[4] wikiHow staff (2019). How to Determine Whether Two Variables Are Directly Proportional. [online] wikiHow. Available at: https://www.wikihow.com/Determine-Whether-Two-Variables-Are-Directly-Proportional [Accessed 14 Nov. 2019].
[5] Helmenstine, A. (2019). What’s the Difference Between Random and Systematic Error?. [online] ThoughtCo. Available at: https://www.thoughtco.com/random-vs-systematic-error-4175358 [Accessed 14 Nov. 2019].
